How to switch between linear/log in 2D plot?
Analysis & Postprocessing
2
Posts
1
Posters
905
Views
1
Watching
-
Hi everyone,
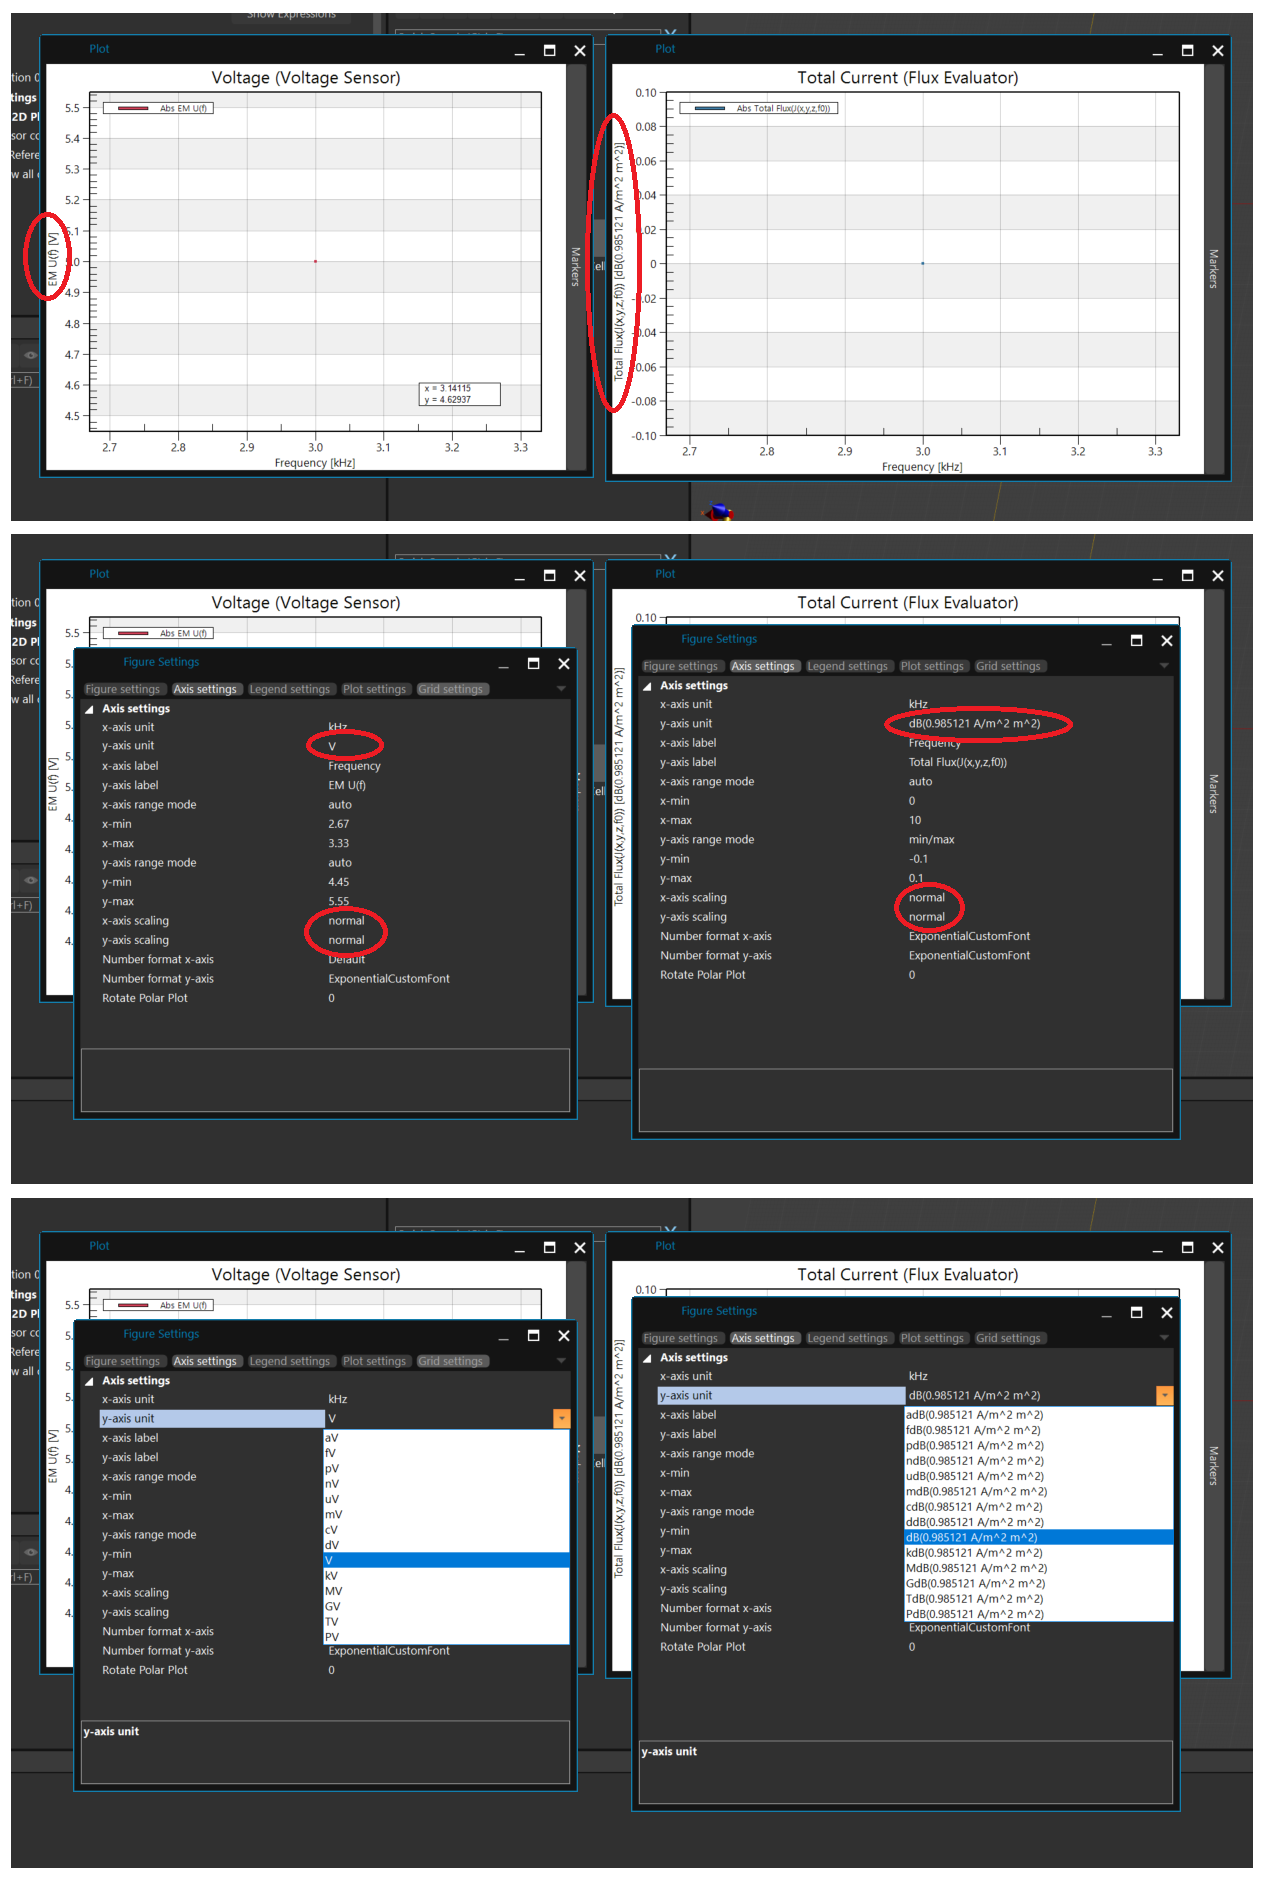
this seems like a silly question, but I cannot find an option to switch the unit (not the scale) between dB and native unit on the y-axis for 2D plot. The unit is predefined according to what quantity is plotted. For example, the voltage reading from sensor is plotted in native unit (Volts), while the total current is in dB of a reference value (see screenshots). Is there a way to change this to Ampere?